When searching for the right fertility clinic, many intended parents turn to the CDC’s Assisted Reproductive Technology (ART) success rate reports. These reports, updated annually, are required by U.S. law and offer one of the most reliable nationwide data sources. But the numbers can be confusing, and if you don’t know what to look for, it’s easy to misinterpret them.
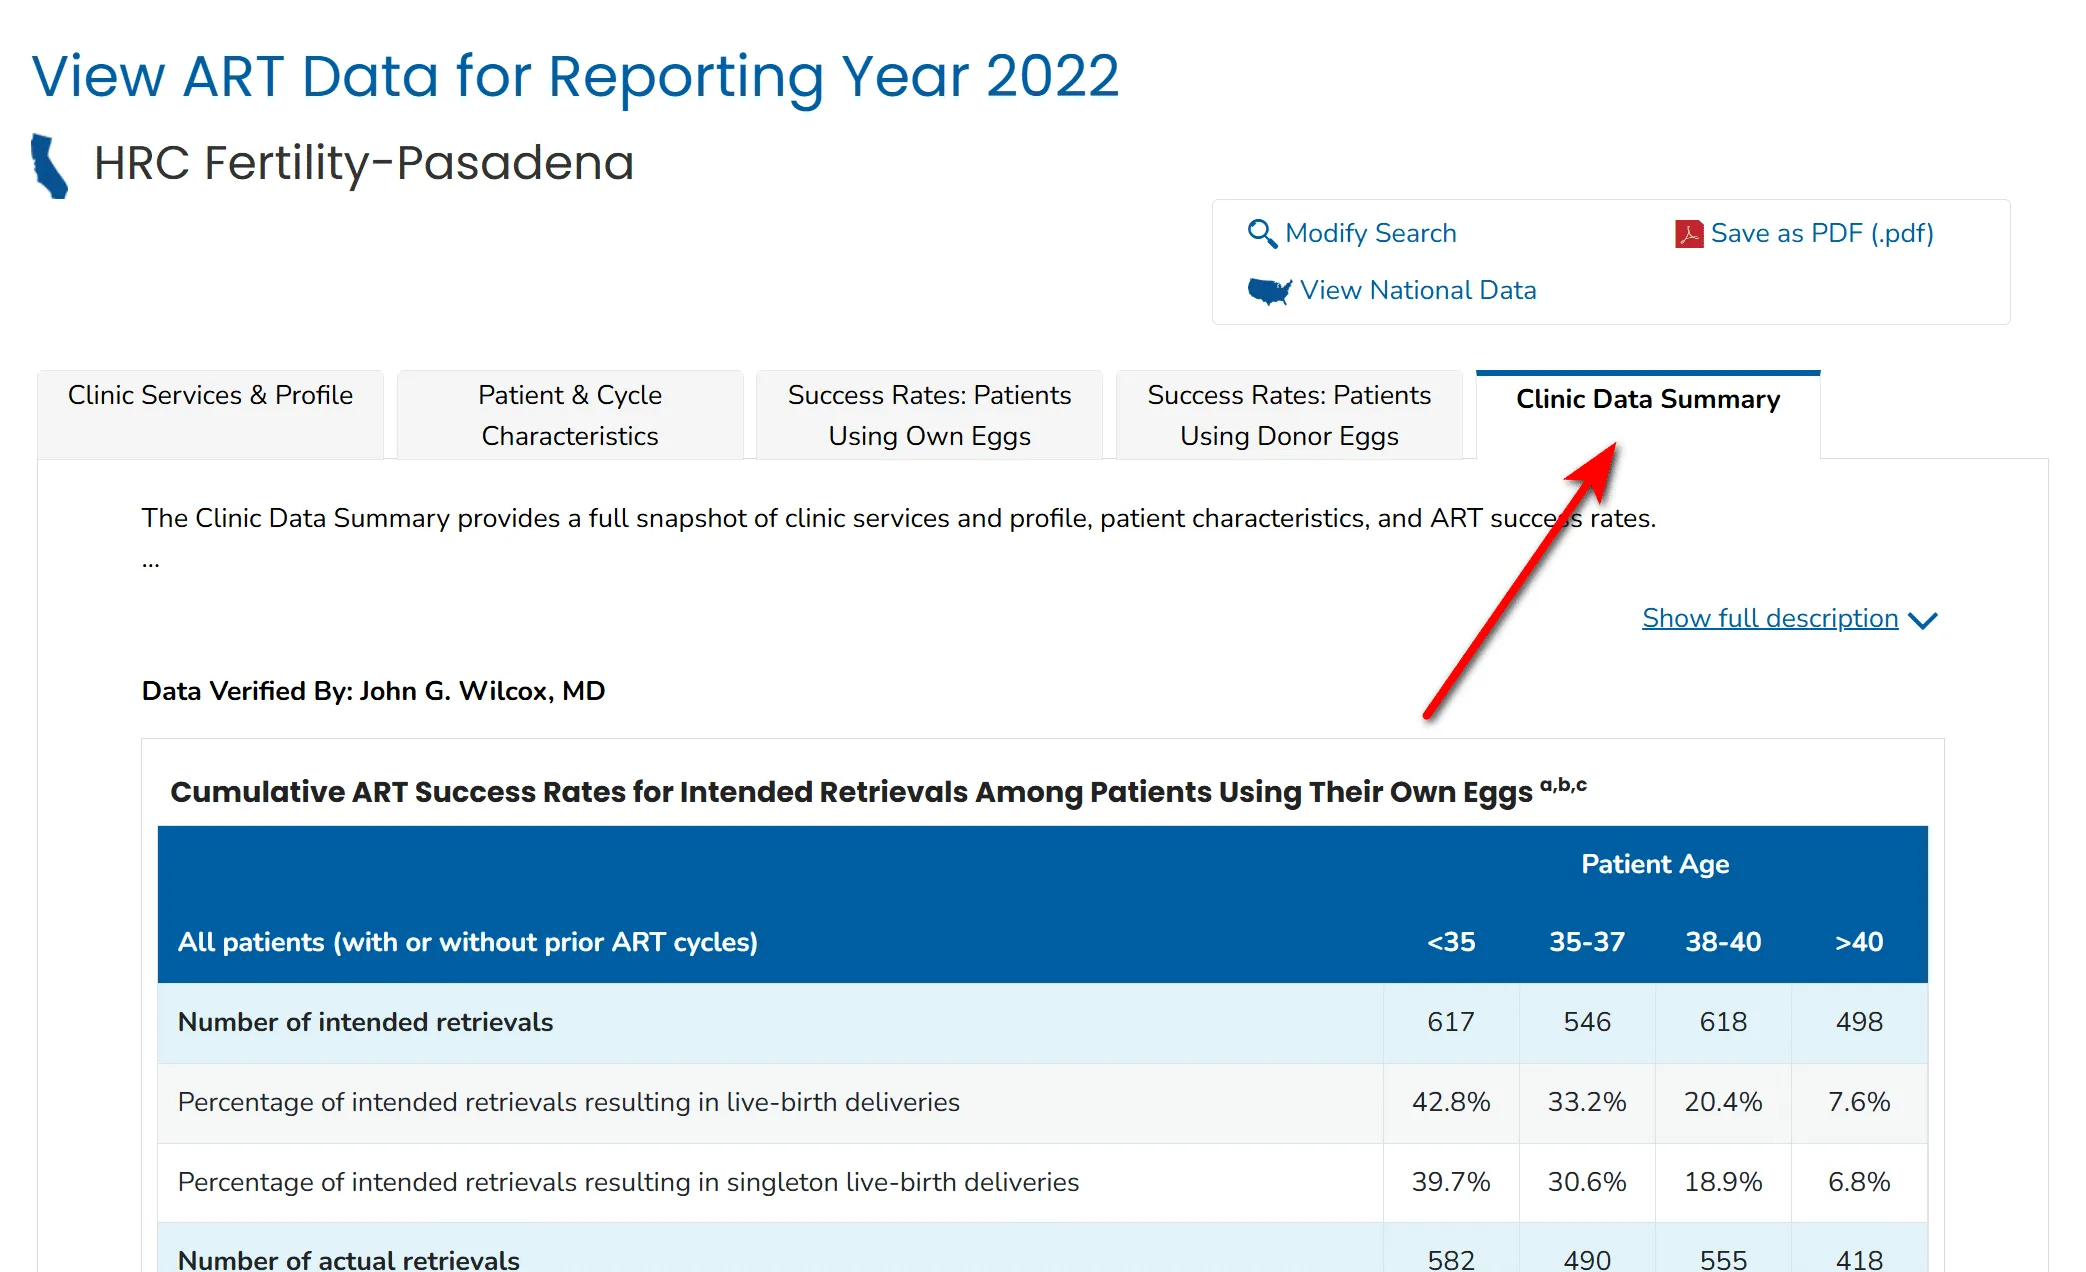
Using the Clinic Data Summary for HRC Fertility Pasadena as an example, this article will show you how to understand CDC IVF success rates and, more importantly, what those numbers really mean.
Key Takeaways (Read This First!)
✅ CDC data is trustworthy but complex: It shows national and clinic-specific IVF success rates, but interpretation requires context. ✅ Look at your own eggs, in your age group: Donor eggs almost always look excellent, but they don’t reflect the clinic’s real performance. ✅ Focus on four metrics:
- Percentage of transfers resulting in live births → higher is better.
- Average number of retrievals per live birth → lower is better.
- Percentage of transfers with PGT-tested embryos → higher means more genetically screened embryos are transferred, which boosts results.
- Average number of embryos transferred per transfer → lower is better, since transferring multiple embryos can raise success rates but also increases the risk of multiples.
✅ Patient characteristics matter: Clinics that attract more complex patients may appear to have lower success rates. ✅ Never judge by numbers alone: Data lags by two years, varies year to year, and reflects clinics, not individual doctors.
1. Why the CDC Data Exists and Why It Matters
The Fertility Clinic Success Rate and Certification Act requires all U.S. IVF clinics to report their outcomes to the CDC. The CDC verifies and publishes these reports so patients can:
- Compare results between clinics.
- See how age and diagnosis affect outcomes.
- Understand national averages and trends.
You can find any clinic’s data by visiting the CDC’s ART website and looking up the Clinic Data Summary. Without this standardized reporting, clinics could selectively present outcomes, making fair comparisons nearly impossible.
2. Key Terms Every Patient Should Know
- Percentage of transfers resulting in live-birth deliveries This measures the chance of a live birth when embryos are actually transferred. It reflects the clinic’s embryo selection and transfer expertise. Higher is better.
- Average number of intended retrievals per live-birth delivery This tells you how many egg retrievals, on average, are needed to achieve one live birth. Fewer is better, as it suggests efficient embryo creation and transfer practices.
- Percentage of transfers of at least one embryo with preimplantation genetic testing (PGT) PGT, usually PGT-A (chromosomal screening), increases the likelihood that an embryo will implant successfully. A higher percentage here means the clinic frequently transfers genetically tested embryos, which can improve success rates.
- Average number of embryos transferred per transfer In previous CDC reports, this metric was clearly displayed, but in the 2022 data release it is no longer included—the reason has not been publicly explained. Historically, this number has varied with patient preferences, embryo quality, and clinic policy. Lower values generally indicate more single-embryo transfers (SET), which reduce the risk of twins or triplets. Where more patients opt for two-embryo transfer, per-transfer success rates will naturally look higher—largely reflecting patient choice and case mix rather than clinic performance.
3. How to Read the Numbers
(1) Don’t focus on donor egg data Donor eggs almost always come from young women (typically under 30), so their success rates are high everywhere. These figures don’t reflect the skill of the clinic or physician.
(2) Look only at your own eggs, broken down by age group Success rates vary dramatically with age. The younger the patient, the higher the chance of success.
👉 Example from HRC Pasadena: In the 35–37 age group, the report shows that the Percentage of transfers resulting in live-birth deliveries is 52.0%, compared to a national average of 46.0%. At the same time, the clinic reports that 89.7% of their transfers used PGT-tested embryos, which partly explains the outcome.
(3) Pay attention to “Percentage of transfers resulting in live-birth deliveries” This figure reflects embryo transfer skill and lab quality. Higher is better.
(4) Check the “Average number of intended retrievals per live-birth delivery” This shows how many attempts may realistically be required. A lower number means the clinic is more efficient in creating and transferring embryos that lead to live births.
(5) Consider the role of PGT Some clinics transfer mostly PGT-A embryos, which naturally raises success rates. Patients should know this when comparing data across clinics.
(6) Patient characteristics Clinic averages are heavily influenced by who they treat. Famous clinics often attract tougher cases, which can lower their reported success rates.
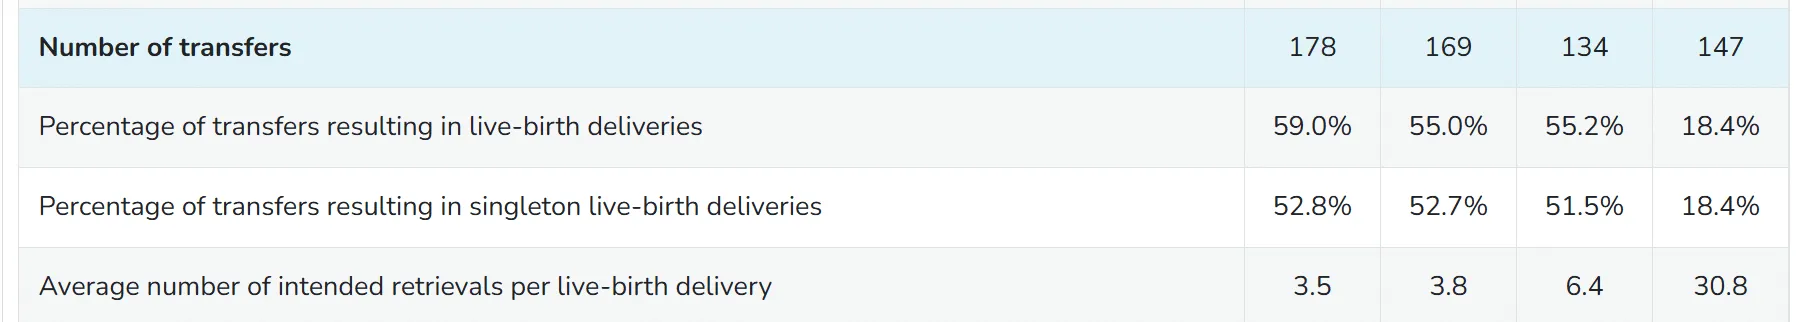
For example, one well-known clinic specializing in mild stimulation protocols treats many patients with diminished ovarian reserve. As a result, their average retrievals per live birth for women under 35 is 3.5, compared to 2.3 at HRC Pasadena. Yet, their transfer live-birth rate is still excellent—59.0%. This demonstrates that raw numbers need context: a higher retrieval number doesn’t necessarily mean poor outcomes—it may simply reflect the patient population.
4. Other Important Considerations
1. Not all clinics report A small number of IVF clinics do not submit data to the CDC, so they won’t appear in the reports at all. When comparing clinics, remember that “no data” does not necessarily mean “poor results”—it may mean the clinic chose not to participate.
2. Data lag The most recent CDC data is usually two years old because outcomes must be tracked through delivery. For example, a retrieval cycle that began in 2021 but resulted in a frozen transfer and live birth in 2022 will only be included once the outcome is known and verified. Patients should keep this time lag in mind when using CDC numbers to evaluate current clinic performance.
3. Clinic vs. doctor The numbers reflect the clinic as a whole, not individual physicians—unless the clinic has only one doctor.
- For instance, HRC Fertility has multiple locations and more than twenty doctors. The CDC data represents the group average, not any single physician.
- In contrast, Western Fertility Institute is led solely by Dr. Kumar. In this case, the published success rates essentially represent his personal outcomes. Because smaller clinics or single-physician practices have less data, their year-to-year results may show greater fluctuations.
4. Sample size matters If a doctor or clinic has only a handful of cases in a certain age group, results can look artificially high or low.
- For example, if a doctor transferred three embryos to patients over 40 and none resulted in live birth, the reported success rate for that age group would be 0%. But if all three worked, the rate would be 100%. Neither number represents a reliable long-term average—it’s just the math of small samples.
5. Year-to-year variation Even within the same clinic, success rates can change significantly from one year to the next. Variations may come from changes in patient mix, the proportion of embryos screened with PGT-A, the number of high-risk cases, or simply random chance. That’s why multi-year trends are more reliable than focusing on a single year’s report.
5. Visual Comparison Example
To make this clearer, here is a simple comparison chart between two clinics (Clinic A and Clinic B).
This visual illustrates why success rates must always be read in context, and why a single percentage alone cannot represent the full picture.
6. FAQs
1. Can I compare two clinics directly based on success rates?
Not reliably. Too many factors—patient mix, PGT usage, stimulation protocols—affect the numbers. For instance, one clinic might specialize in older patients or those with diminished ovarian reserve, while another might work mostly with younger patients. The raw percentages will reflect those differences more than physician skill.
2. Should I ignore donor egg data completely?
For judging clinic skill, yes. Donor egg cycles are overwhelmingly from young, healthy donors, so they tend to succeed at high rates across the board. If you are evaluating your own chances with your own eggs, focus on your age group instead.
3. What’s more important, per-retrieval or per-transfer success rates?
It’s best to consider them as two complementary parts of the same story. They answer different, but equally important, questions:
- Per-transfer rates tell you about the quality of the lab and the physician’s skill at the final stage.
- Per-retrieval metrics tell you about the overall efficiency of the entire process from start to finish.
A great clinic should perform well on both fronts.
4. Why does one clinic show much higher retrieval numbers per live birth?
This usually means they serve more challenging patients. For example, clinics focusing on mild stimulation protocols may see higher average retrievals per live birth, since those patients often produce fewer eggs. It doesn’t necessarily reflect poor care—the transfer success rate can still be excellent.
5. Does a higher PGT percentage mean the clinic is better?
Not always. It does mean the clinic is transferring more embryos that have already passed chromosomal screening, which naturally boosts outcomes. But if one clinic uses PGT-A in nearly all cycles and another uses it in fewer, you must keep that difference in mind when comparing success rates.
6. Why do results vary so much from year to year?
Success rates depend on many shifting factors: patient mix, the percentage of embryos screened with PGT, the number of high-risk patients, and even chance. One year’s strong performance doesn’t guarantee the same next year. Looking at trends over several years is more reliable.
7. Conclusion
It’s nearly impossible to rank clinics solely by success rates, because too many factors influence the numbers. For example, a clinic with a 50% live-birth rate per transfer is not automatically “worse” than one with 60%.
Author’s note: In my view, if two clinics show a 15% or greater difference in the same age group, with similar use of PGT-A embryos and comparable patient characteristics, that difference may still be meaningful. This is not an absolute rule, but rather a guideline I use when interpreting CDC data.
Use CDC data as a guide to ask better questions, not as the final word.
Next Steps for Intended Parents
At Ivy Surrogacy, we understand that navigating IVF data can feel overwhelming. Our team helps intended parents interpret the numbers, understand how national benchmarks apply to their unique situation, and connect with trusted clinics and doctors.
Instead of facing the data alone, let our experts guide you. We can help you look beyond the percentages and make a truly informed decision.
📞 Confused by a clinic’s report? Let’s decode it together. 👉 Contact Us for a Complimentary Data Review


